
Without doubt, one of the most common questions I hear in my work is “Alana, how do we display qualitative data?” The short answer is there is no hard and fast rule on this. Unlike quantitative data, qualitative data really needs you to think a little bit more abstractly. You need to ask yourself, how am I going to get my data across in a way that’s engaging and meaningful for my desired audience? How do I condense and translate these important messages and themes?
A lot of the work that I do for our Child and Community Wellbeing research team is displaying qualitative data. So, I thought I’d share some examples of just how we can do this, and how simple it can be.
So, let’s start with the basics. If you are conducting qualitative research, you are most likely conducting interviews or focus groups. The richness of data that comes out of these cannot be underestimated.
This naturally leads us to our first option.
Quotes
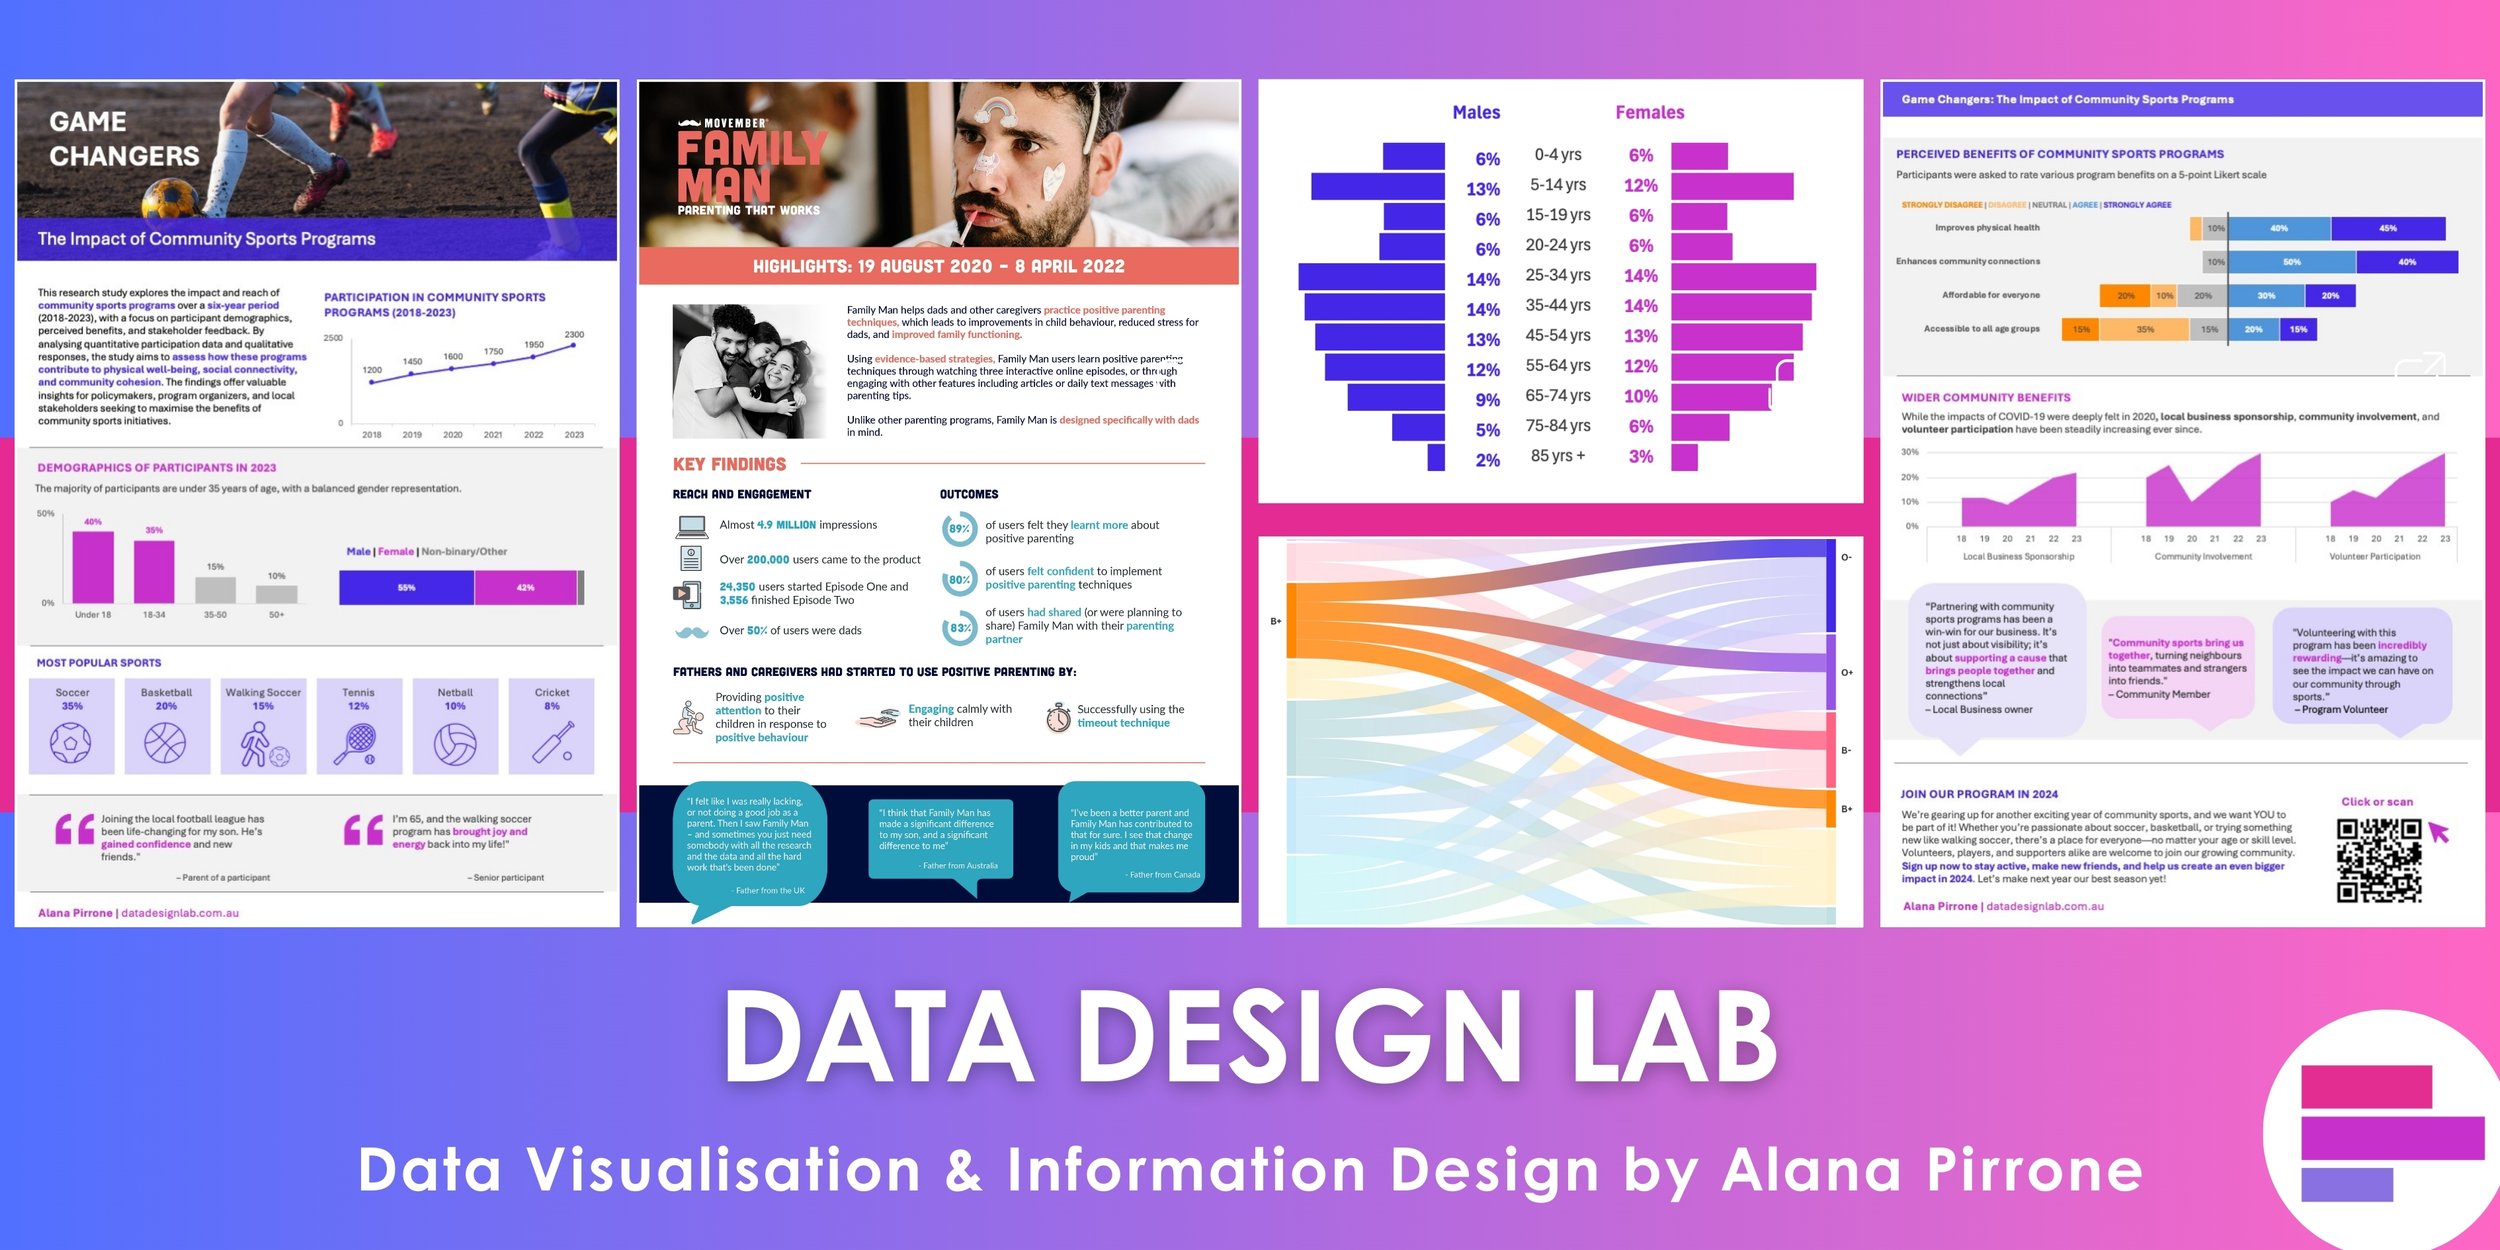
Now, before you start yelling at your computer screen saying, “I know this already!” hear me out. We’re not just going to make our text italics and indent it slightly. No way! I actually can’t stand italic text, but that’s a story for another day. We are going to use some graphic design magic to make those quotes pop!
How do we do it?
Bold and action colour
As Stephanie Evergreen says, we will use an action colour to highlight the important words in that quote. We will also bold those words. This breaks up the text a little, and adding those visual attributes highlights the really important parts of the quote.
Large quotation marks
I’m sure you’ve seen this before. It’s not a new trick but it’s effective. If you have a text heavy report, this is a great way to break it up and make it more digestible. On a PowerPoint slide, have nothing else but the large quotation marks and the quote.
Indent and all colour
Another great one for text heavy reports is to indent the quote and colour the whole text. A vertical line on the left of the quote, which lines up with the body text makes it look neat and tidy.
Different ways to display quotes
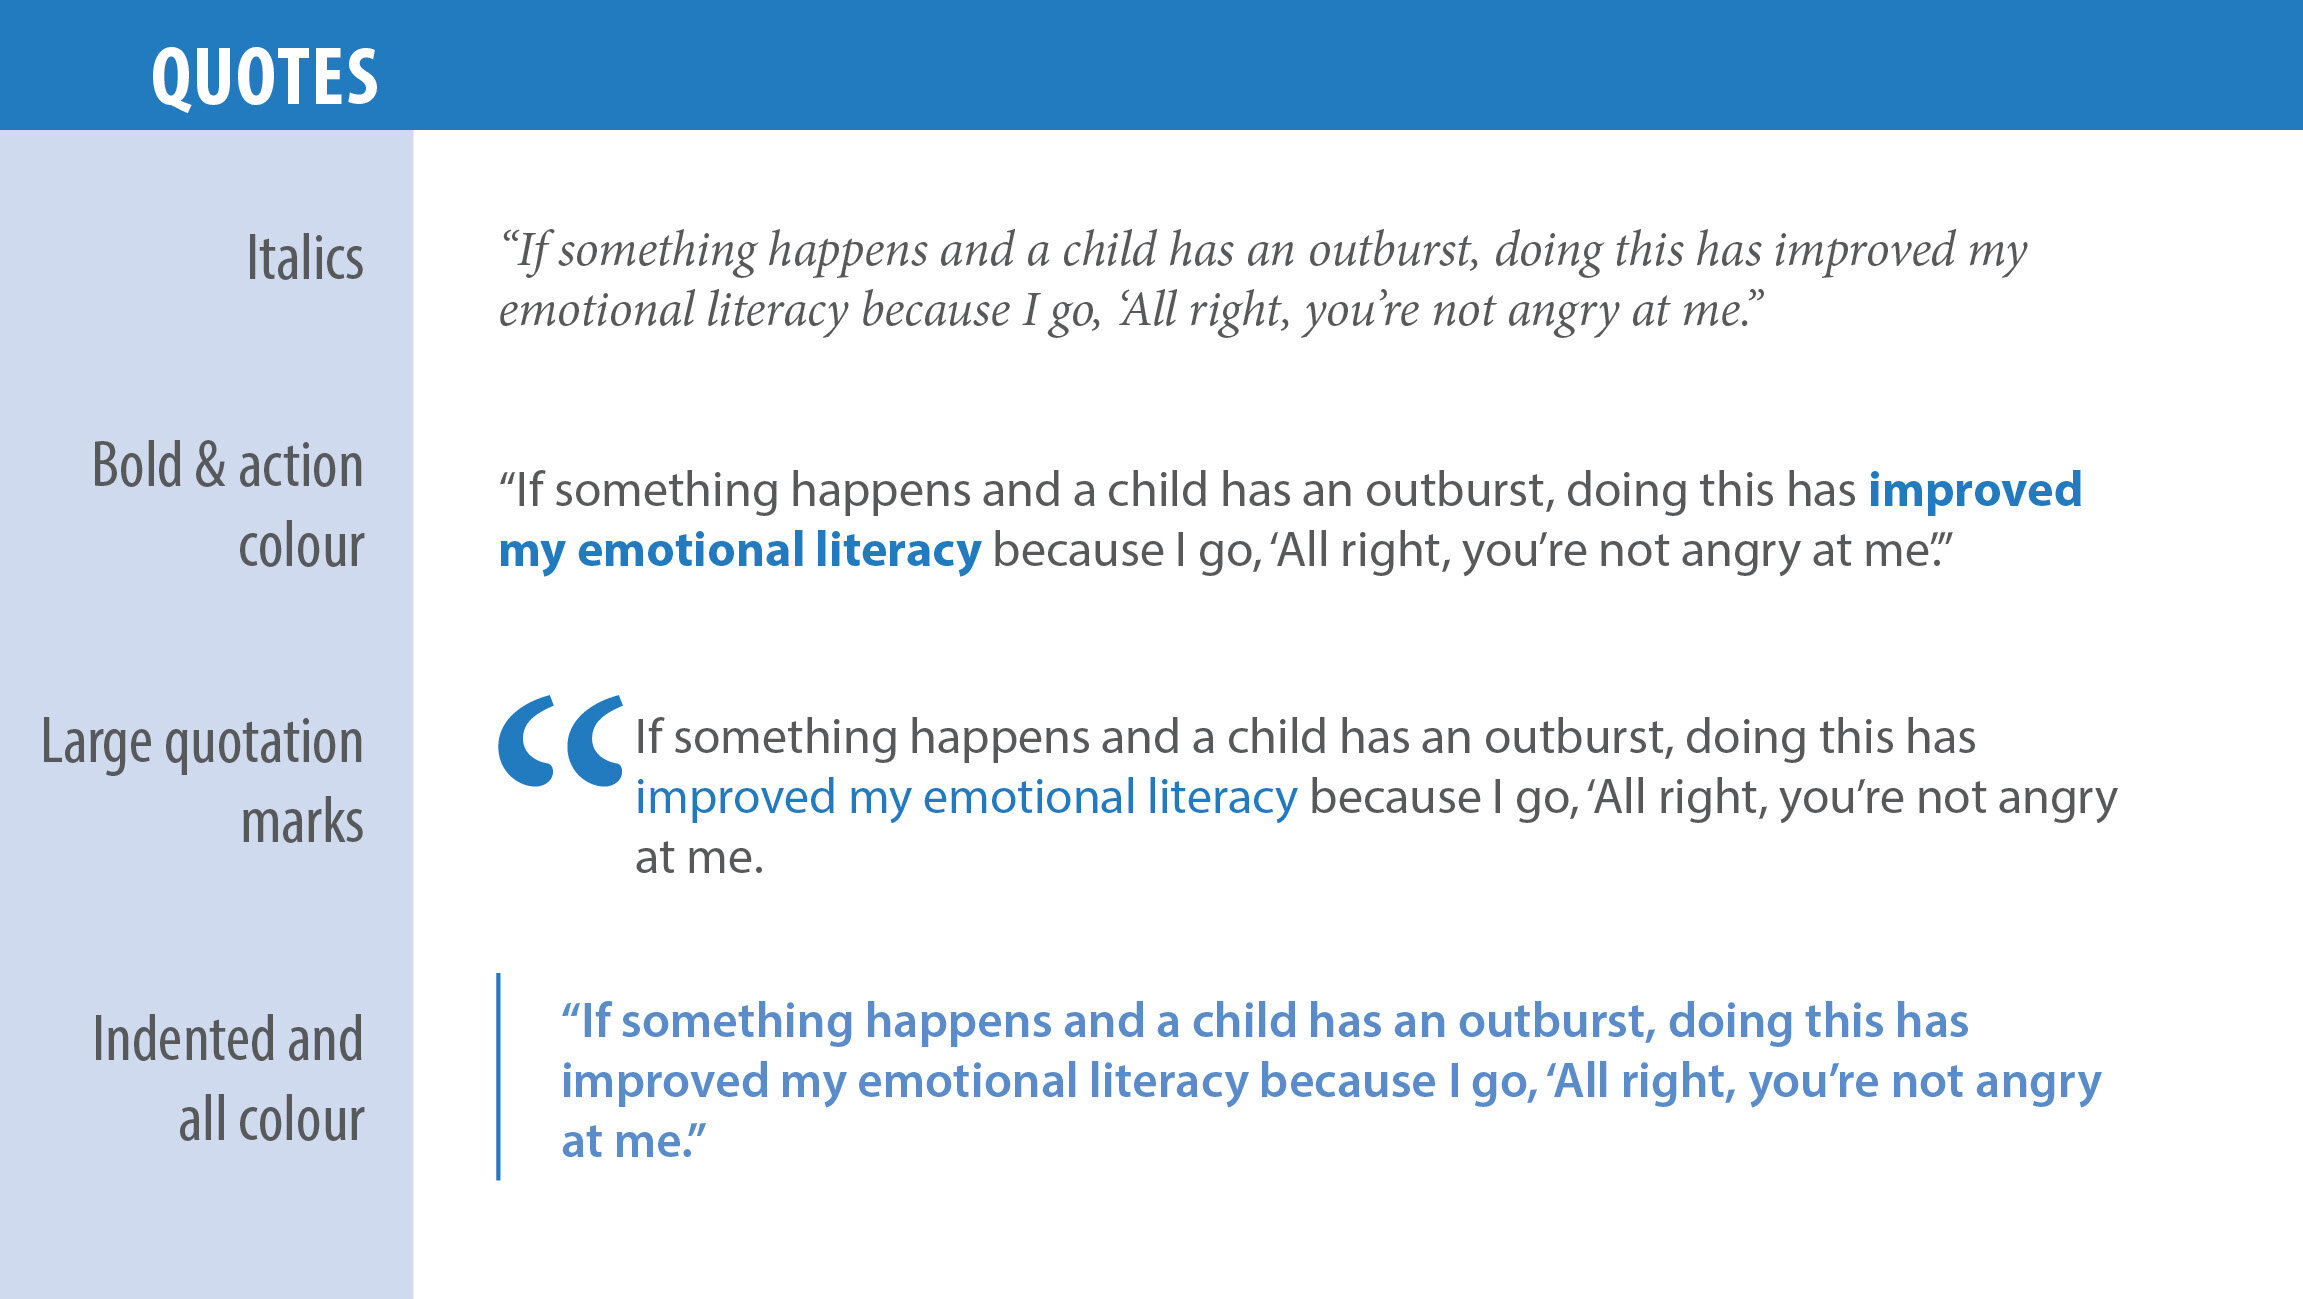
I’ve added some examples of quotes I have used in my work. With all options, make sure you have enough white space around the quote to make it stand out and not look squished.
Examples of displaying quotes
The next obvious choice for qualitative data display is Images.
Images
As the old adage goes, ‘an image is worth 1000 words’. This article about the Thai boys who were stuck in the cave in 2018 sums it up perfectly. We are visual creatures who are drawn to images that evoke our emotions.
During data collection of the Beyond Bushfires study, our team would go out and conduct one-on-one interviews with participants. Often the participants would walk them around the local area or the bush and show particular places that were special to them. Our team always had a camera in hand and took photos to capture these moments. Many of these photos were used in the final report of the Beyond Bushfires study.

Images of the Beyond Bushfires final report
In a PowerPoint presentation, replace text or a quote with a photo that showcases that text. If you didn’t take one during data collection, there are a number of online sites that you can get free photos from like pixabay.
In a report, try to have images or graphics on most pages. It breaks up the text and makes it more digestible. When I create one-page research summary infographics, I also aim to include an image, to draw people in.
Icons
Whether it’s a quote or text explaining common themes from your qualitative data, break it up with the inclusion of an icon. Again, this is a technique I commonly use in my work. John Medina tell us in Brain Rules that when people see a chunk of text, they are likely to remember 10% of that information three days later, however when people see text combined with a relevant image, they are likely to recall 65% of that information three days later.
Use icons to show common themes in your results, or to show data collection measures. Here are some examples I have used.
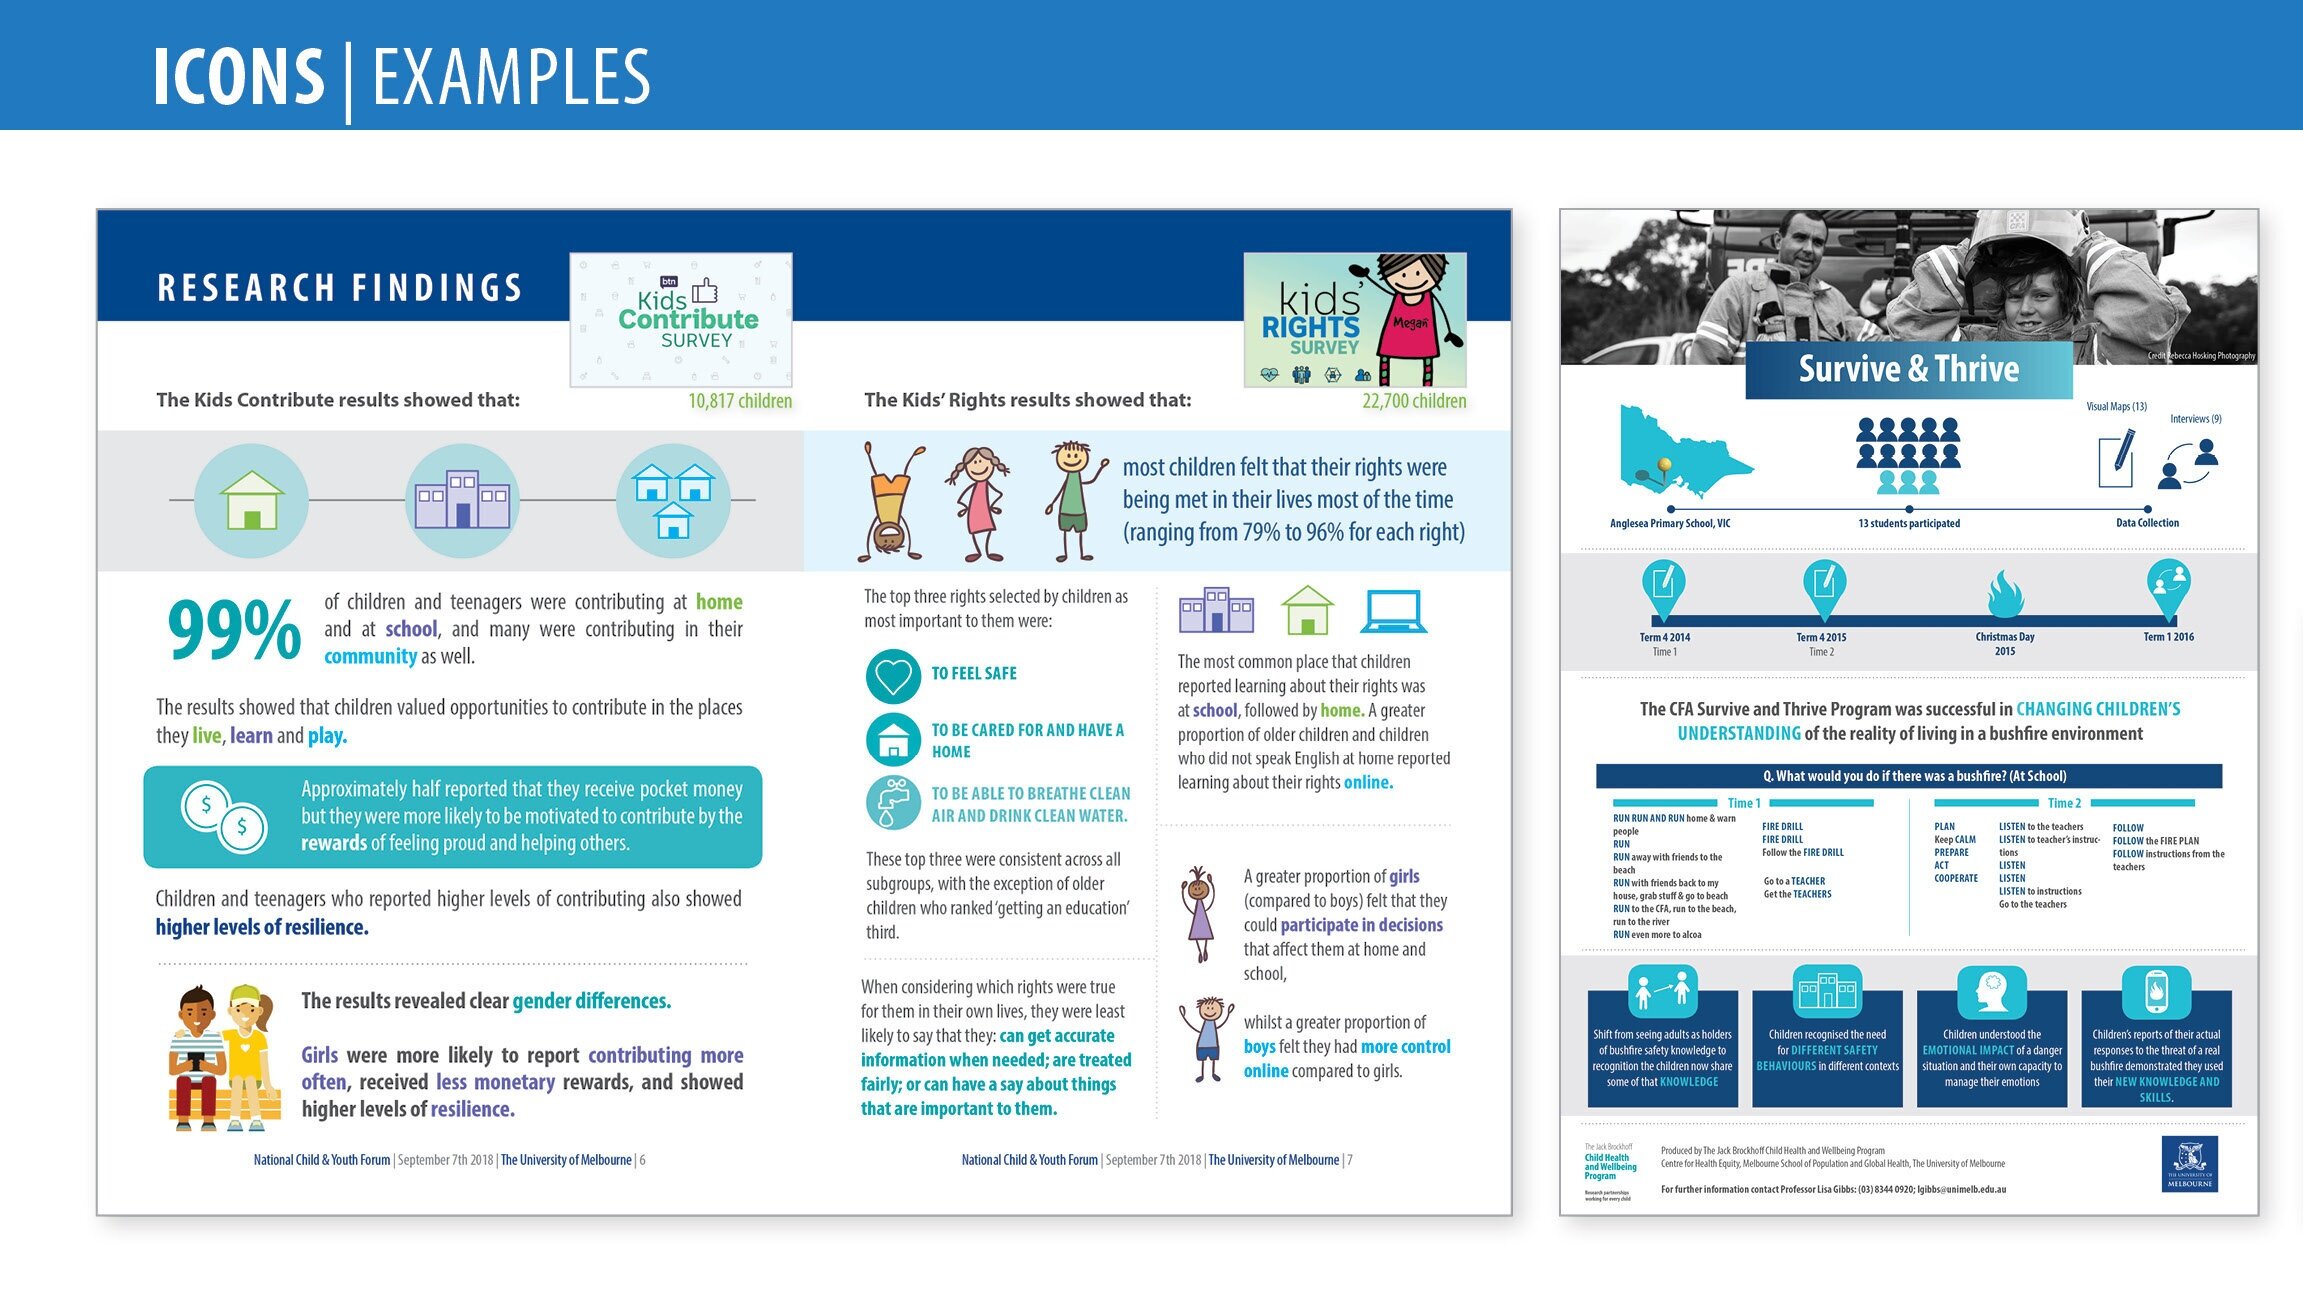
Examples of icons
Word Clouds
I’ve been very vocal with my thoughts on word clouds. There are only two times I would consider them useful. The main one is for showing comparisons over two time-points. For example, before and after or 2019 vs 2020. Even then, it’s not about dumping whole transcripts of interview data into the word cloud generator. It’s useful for short answer responses so it’s easy to see common themes emerging between the two time-points.
Here is an example from our Survive and Thrive study. We used a visual mapping exercise where children were asked a series of questions about what they would do in a bushfire and who they would give information to. This was done twice, before and after the CFA training.

Word Clouds used for comparisons over time
The other time I use word clouds is during a presentation when I showcase the Poll Everywhere software. You can ask your audience a question (usually requiring a one word response) and answers start to populate on screen in front of you. Example below from my July course. For more in depth thoughts on word clouds, please refer to my previous blog ‘Are word clouds dead? The answer is yes but no’.

Using Poll Everywhere for word clouds.
Colour-coded phrases
Another great example provided by Ann K Emery and published in the New York Times, is colour-coded phrases. In this example, they have gone through Donald Trump and Hilary Clinton’s Nominees’ Convention speeches and used colour to code them into negative and positive statements about America. This simple technique gives a quick overview of the tone of the transcript. I would avoid using red and green to show negative and positive associations because of accessibility issues. Instead try blue and orange.

Colour-coded phrases.
Venn Diagram
A Venn diagram is a great way to show different sets or themes in your research and how they overlap and intersect. We, the Child and Community Wellbeing Unit, use a Venn diagram to show how our body of research and three focus areas overlap, with our main goal in the middle.
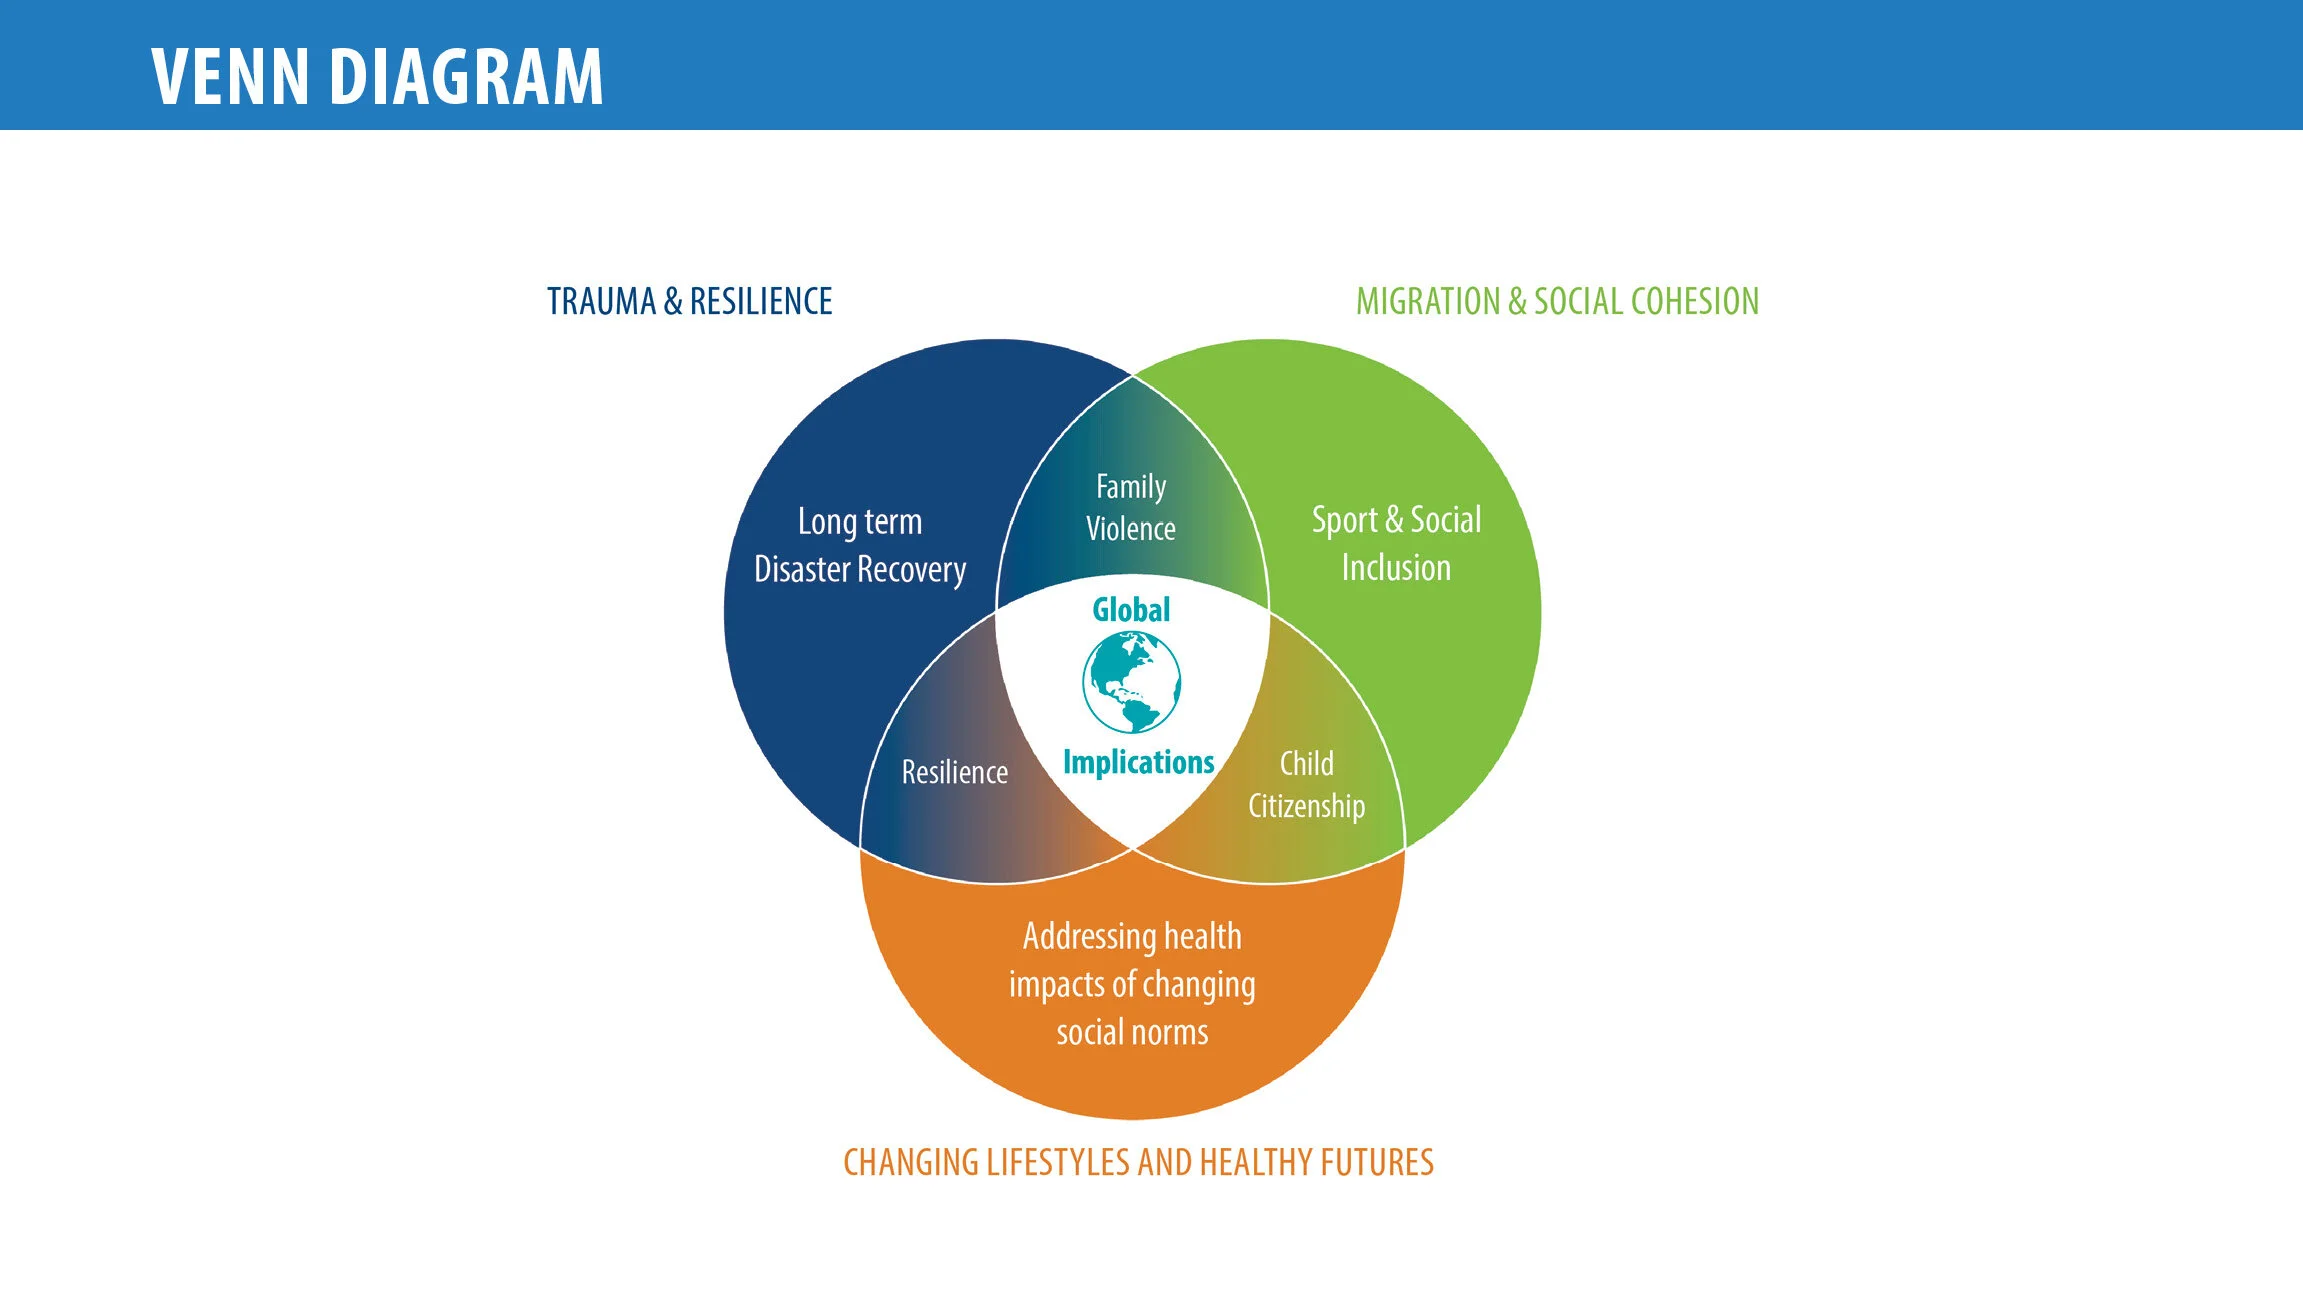
Venn diagram of Child and Community Wellbeing Unit
A brilliant example of a larger Venn diagram with more intersections come from David McCandless. Here he has visualised what makes a good visualisation.

What makes a good visualization by David McCandless https://www.informationisbeautiful.net/visualizations/what-makes-a-good-data-visualization/
Timeline
The last example I will present you with is a timeline. Timelines are especially useful for visualising longitudinal studies where data collection has occurred over multiple time points.
It can show results or simply the study outline, design or even initial project plan.
Below is a detailed timeline produced for the Beyond Bushfires study looking at project engagement activities.

Timeline examples
However, timelines don’t need to be this detailed. Above is another one I included on the Survive and Thrive infographic.
There are many more ways to display qualitative data, but I won’t overload you with too much information. I will save that for another blog post. Remember to think visually and use icons and images to help illustrate your important themes and messages.
Happy designing!