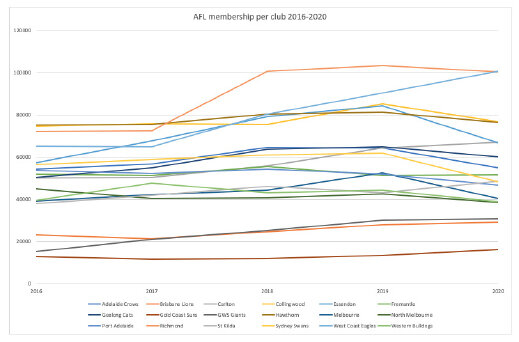

I’ve been working with a few local councils over the last year. One thing that regularly pops up is the need to display and compare data over two time points. I scoured the web to find a good example and came across one local council’s website showing a comparison of their performance from 2019 to 2020. This repeated cross sectional data looks at seven main measures and are displayed using percentages in a standard table. I’ve changed the results slightly for anonymity purposes, but it looks a little something like this.

Summary of council’s performance. Displayed as a table
How many different ways could we effectively display this data? I’ve come up with six variations, all with positives and negatives. Let’s have a look through.
Display 1 – Clustered bar chart
This is by far the most frequent display that comes across my desk. It normally looks a little something like the one below.
While a clustered bar chart can be a valid option to use, we need to steer away from the standard Excel template and make some big improvements.

Clustered bar chart in Excel
Let’s make some changes!
Some of the category names are quite long and therefore Excel has angled the writing on the X axis. Swap it to a horizontal bar so none of the writing will be squished or angled and it’s much easier for your audience to read through.
What is the focus? In this chart 2020 is our main focus with 2019 there for comparison. Therefore, use an action or focus colour for 2020 (in my case blue) and grey for the comparison (2019).
Add data labels directly to the chart, that way your audience doesn’t have to dart back and forth to work out the values.
Remove all the clutter like the gridlines and border.

Display 1 - clustered bar chart
With the improvements your chart should look something like this. As I’ve said before, people know how to read bar charts so you don’t run the risk of your audience not understanding it. However, it is very busy and may require a bit more visual processing time, so we risk the audience skipping over it all together.

Display 2 - Back-to-back bar chart
Display 2 – Back-to-back bar chart
This back to back bar chart is a little easier to navigate through. We have a horizontal bar for 2019 and a mirrored horizontal bar for 2020. They share the same spine.
Again, we are focused on the 2020 results, so I have coloured them in our action colour blue and ordered them biggest to smallest. We can easily assess each category individually and then by its equivalent year.
This chart works for all necessary purposes. Without the data labels directly embedded it could be a lot harder to decode by comparing lengths.
Display 3 - Dumbbell dot plot
Display 3 - Dumbbell dot plot
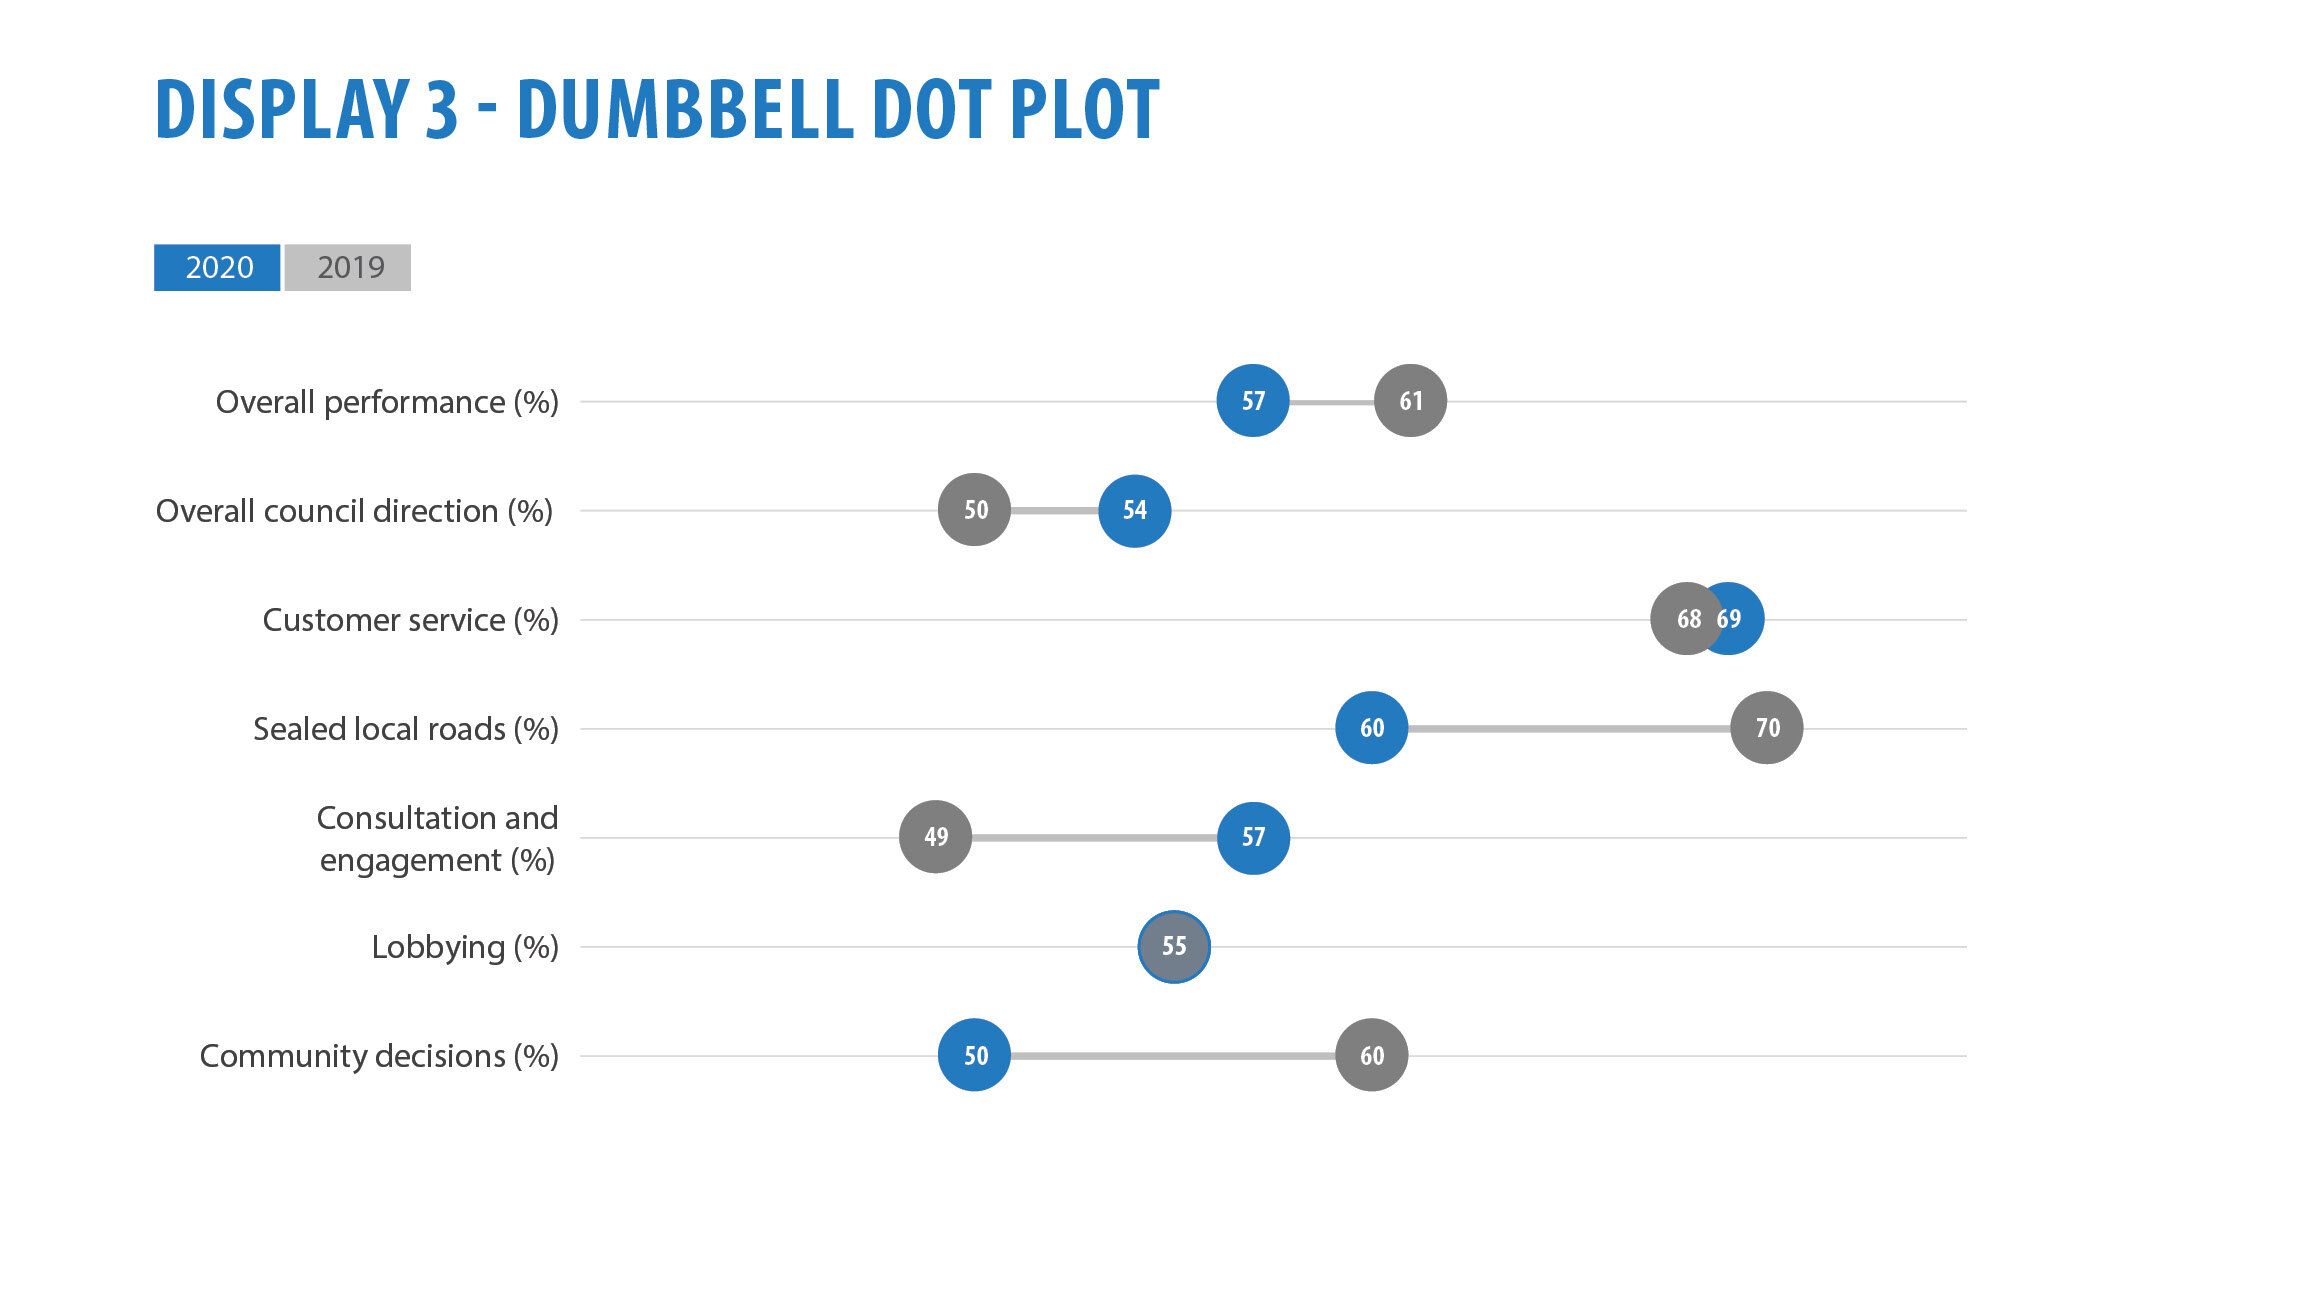
Here we have our categories on the Y axis, percentage values across the X axis and data series displaying 2019 (grey) and 2020 (blue). The points are connected by a thin grey line.
The benefit of this chart over the clustered bar and back to back bar is that we can focus a lot more on the change between the two time points. Why is that? Because unlike a bar chart which needs to start at 0 to accurately decode the chart, a dot plot can start at the lowest value (or thereabouts). In my case the X axis starts at 40%.
There is a lot more white space on this chart which makes it easier to take in and we are drawn to the length of the grey line in between the two circles. In the case of “Lobbying”, the values have stayed the same over the two years. I’ve represented this with a grey circle and a blue border. If your values are too close together, this chart may not be the most suitable.

Display 4 - Table with Sparklines
Display 4– Table with sparklines
Sometimes the best solution for displaying your data may be keeping it in a table. It could be that you have a large number of categories or that you were required to add a table of results in the appendix of your report. Whatever the reason, add an extra column in your table and insert sparklines so your audience can easily see the trend or pattern in the data. Excel has a sparkline feature which is simple and intuitive to use. Go one step further and colour code your high and low points. In the case above, I have used orange for the low point and blue for the high point.
It should be noted that the Y axis of the sparkline is measured by the highest and lowest point of the data in that particular row. Therefore, it may not be accurate to compare between sparklines. If you want a consistent axis throughout, you can change this under the sparklines tab by clicking Axis > Vertical > and select Same for all sparklines under Minimum value and Maximum value.

Consistent axis between sparklines
Display 5 - Small multiple bar charts
Display 5 – Small multiple bar charts
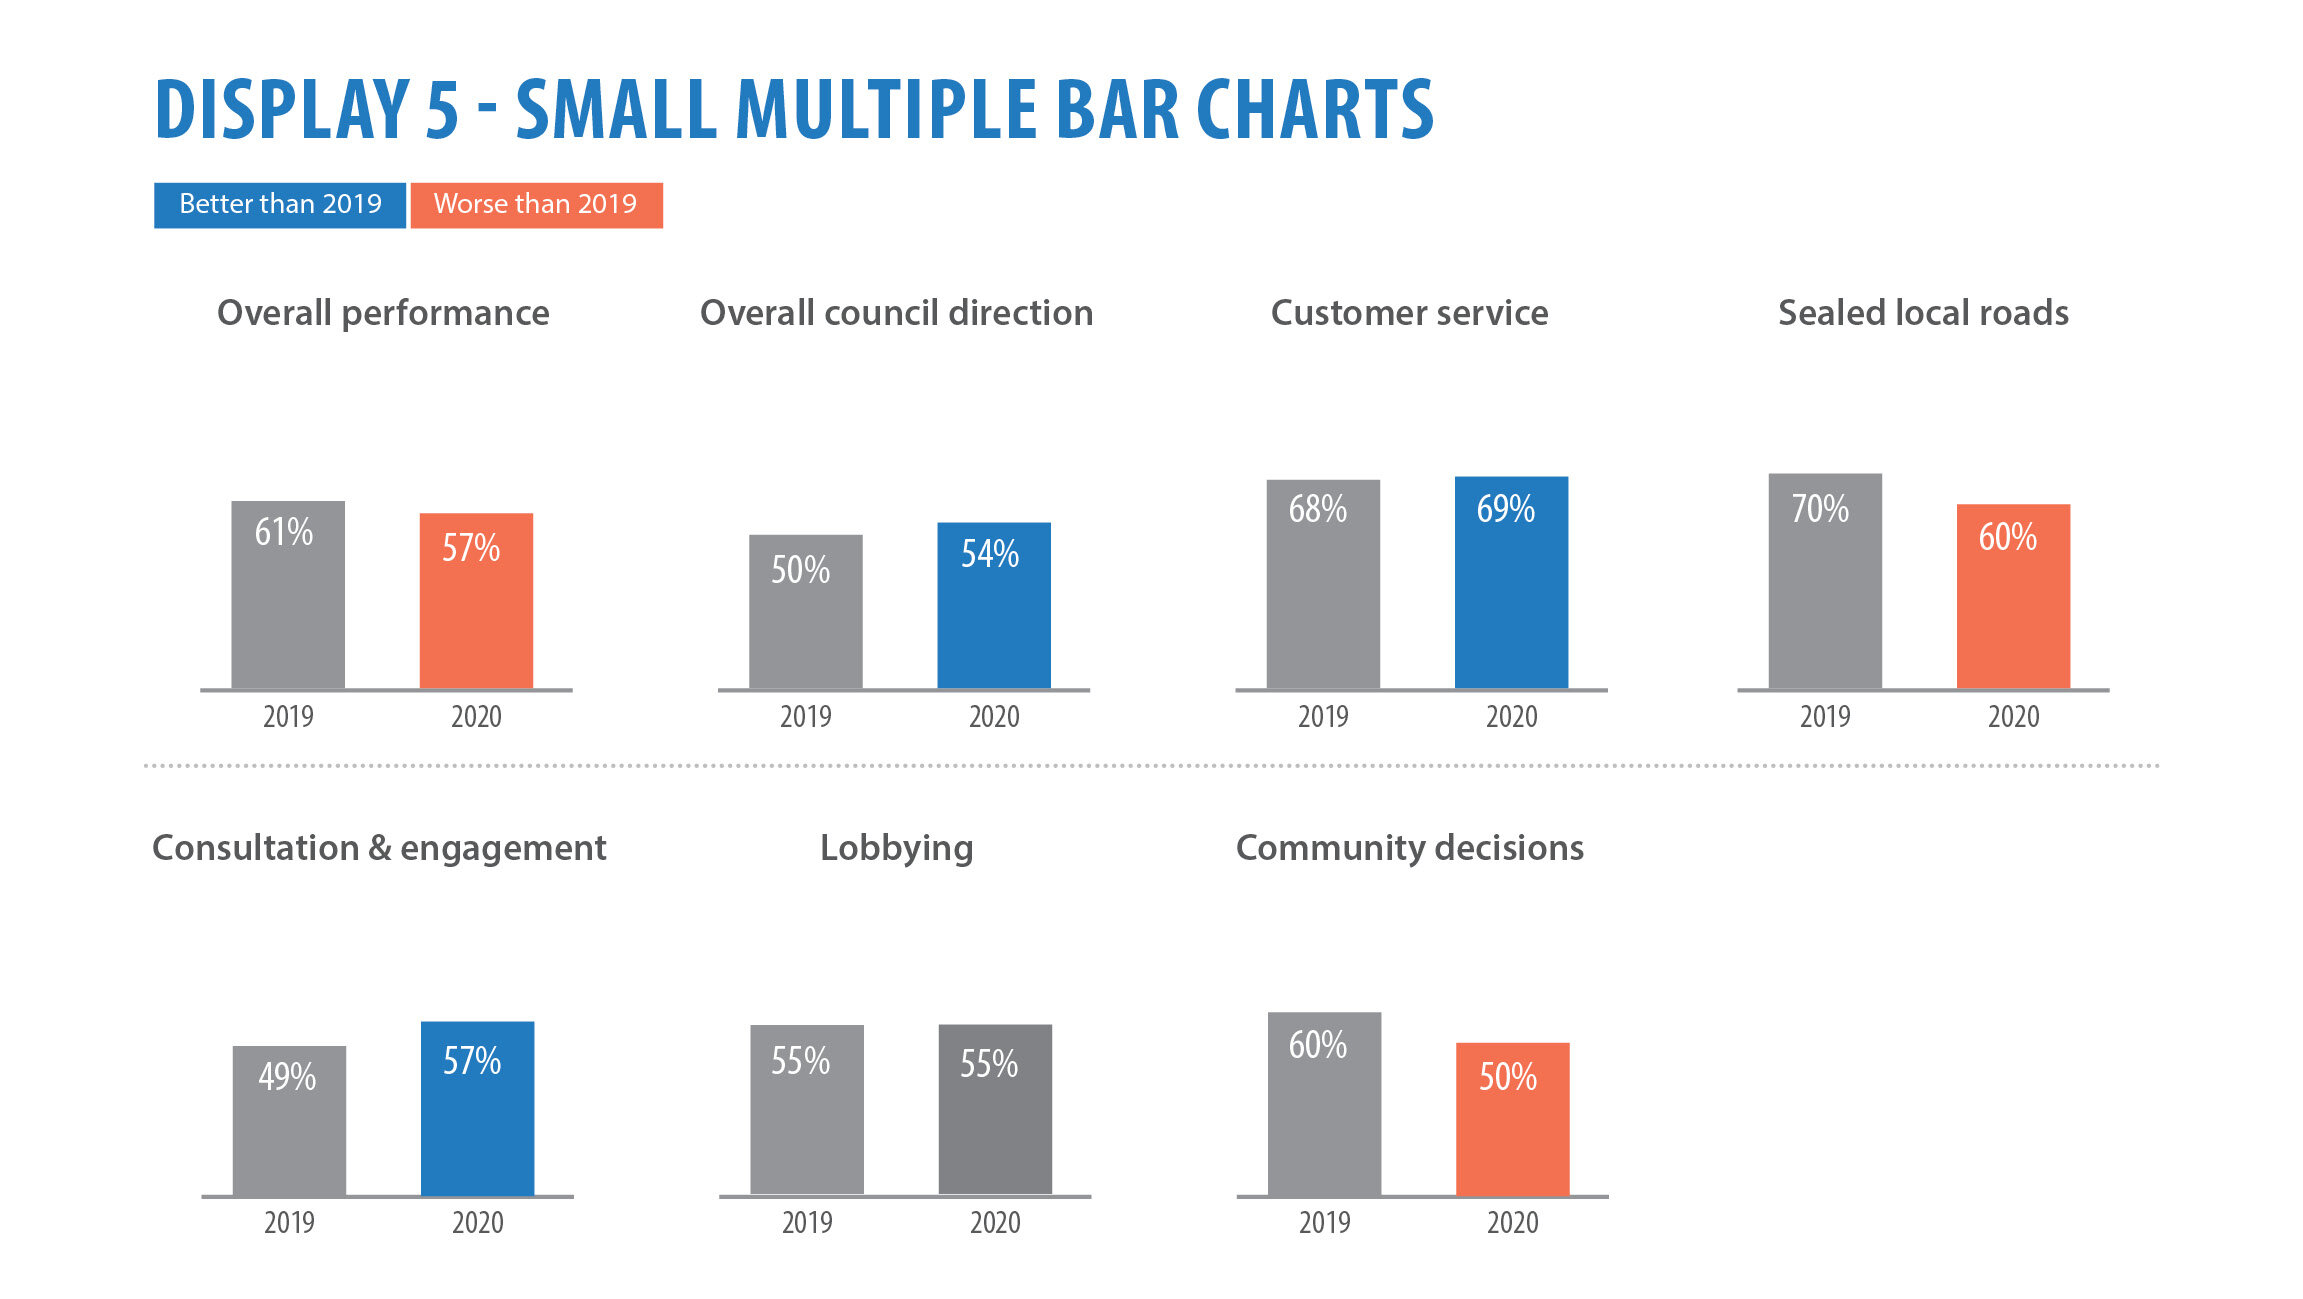
Now we are getting down to the business end. If you have a busy chart with a lot happening, consider small multiples. They are an efficient way to break down a cluttered chart that allows your audience to walk through one category at a time and make comparisons.
In this case, we have seven smaller bar charts each representing one measure. They are all designed to the same scale so we can compare not only within each chart, but across the categories as well. I have colour coded 2019 in grey as it’s there for comparison, and 2020 in either blue, if it did better than the previous year, or orange if it did not.
On quick glance we are able to see there are three blue bars and three orange. We are easily able to navigate through each category or measure and see how it’s performed against the previous year. The advantage of small multiples is that you can split them up and use the individual charts throughout a report or PowerPoint presentation as well.
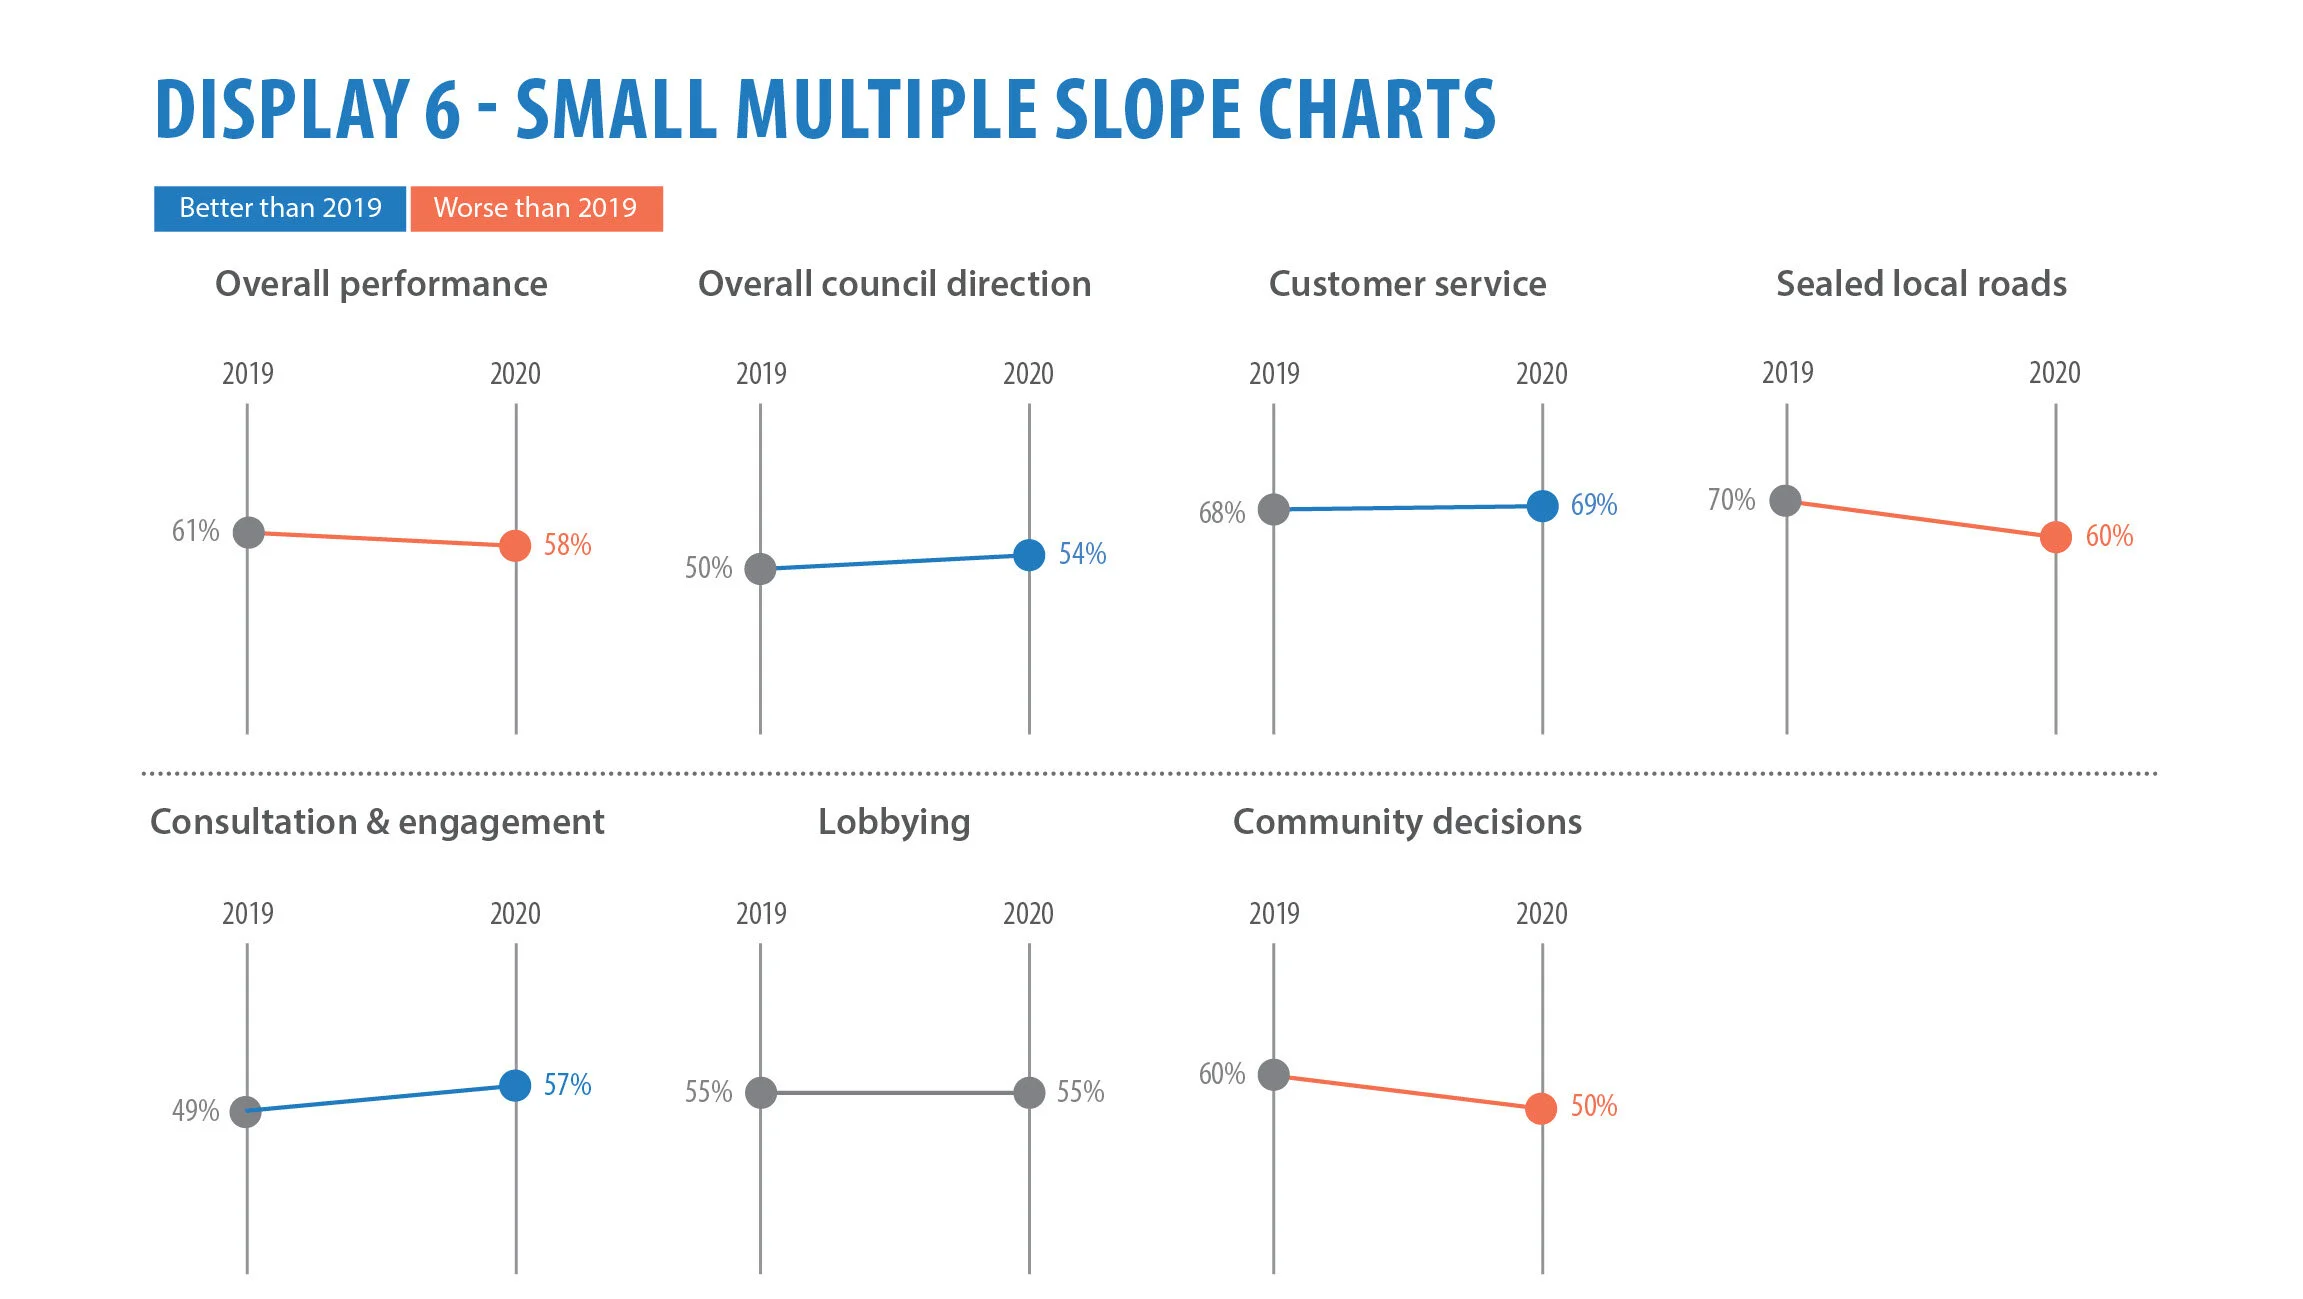
Display 6 - Small multiple slope charts
Display 6 – Small multiple slope charts
In sticking with the small multiple theme, a slope chart is an excellent way to display and compare data over two time points. We are decoding the slope chart by not only looking at the position of the dots but also the angle of the line that joins to the dots. By colour coding blue for positive performance and orange for negative, I’m further aiding readability and digestibility.
Like the previous small multiple bar chart, we can split this chart up and use it in different sections of our report or PowerPoint too.
In summary, I have presented you with six different options for displaying your data over two time points. There is no right or wrong answer, rather options for you to consider and get inspiration from.
Remember:
Consider who your audience is and the best way to reach them.
Draw focus where it is needed. Push everything else to the back for comparison.
Aid in digestibility by adding that storytelling element to your chart.
A lot to consider, but some options above to help your thinking. Happy designing!
Thank you to my friend and colleague Dr Elena Swift for her advice and assistance in writing this blog.